Assignment 1: Getting acquainted with VTK
The goal of this assignment is to set up an environment to do some visualization programming. You will be using the VTK library to do most of the heavy lifting, and in this homework, the goal is to understand the standard structure of VTK programs, as well as the important moving parts. Hence, the tasks are intellectually not too challenging and mostly aim at understanding particular aspects of VTK.
You will be using Python (3) to write VTK programs, as this offers a high level of convenience of working with VTK. While VTK is written in (and can be used from) C++, the level at which we will be using it is ideally suited to a high-level language, and VTK/Python is a well maintained binding for VTK. The VTK program structure and major classes are the same in all languages. (Feel free to look at the VTK C++ examples online.)
If Python is outside your comfort zone, rest assured that passing knowledge should be sufficient, such as can be obtained from one of the many excellent tutorials on the web.
IMPORTANT: Before you get started, please read the Installation Guide to get your environment up and running.
Task 1: Setting up VTK with python (1P)
For the first exercise, start the first python script by typing: python ex1.py. A new window should open and you should see the following:
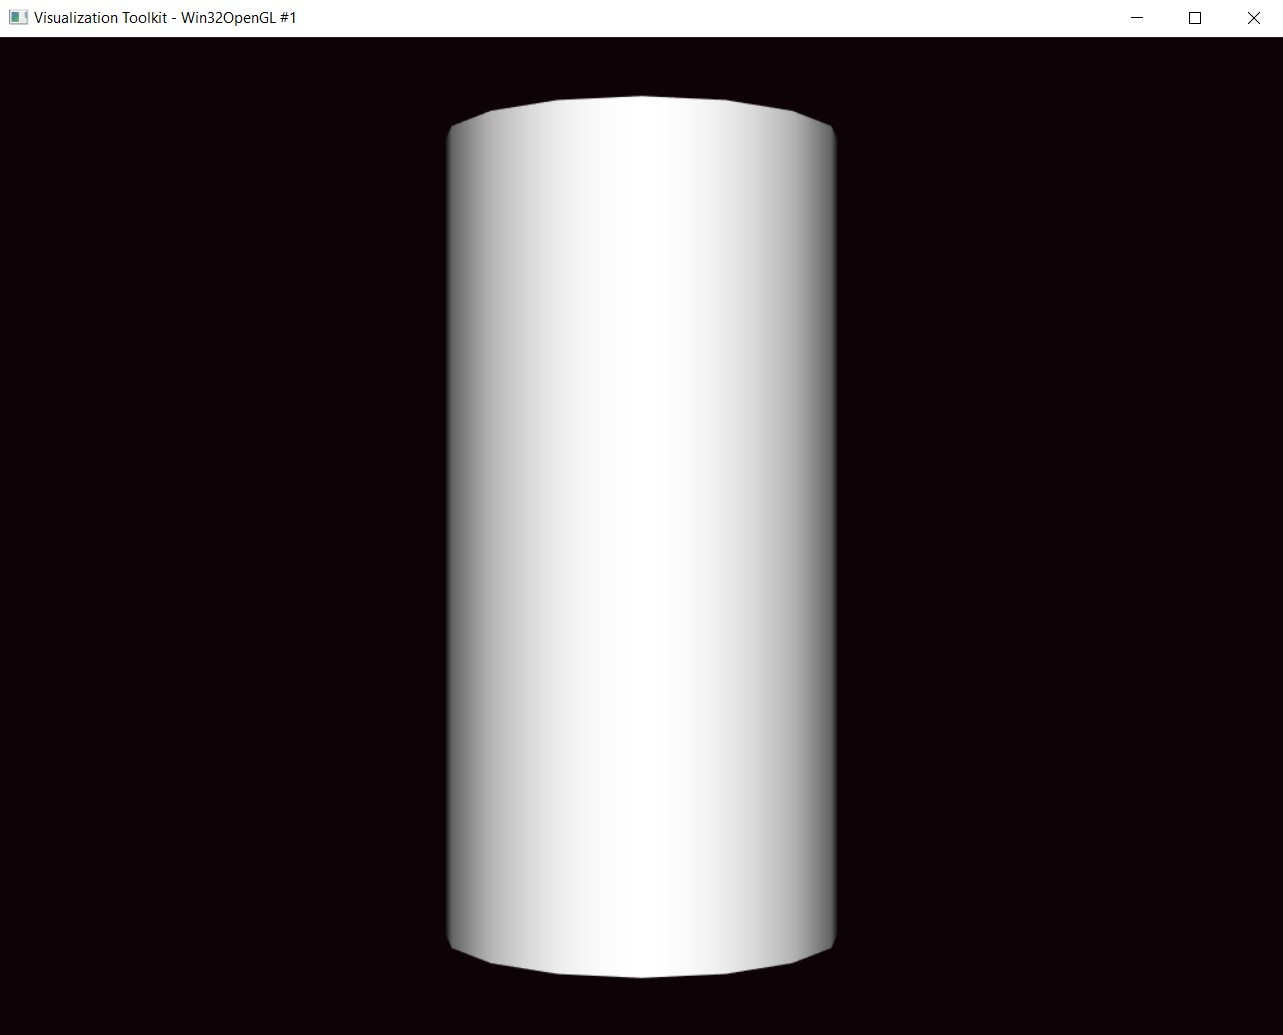 .
.
Summary of Tasks: Play around a little bit to make sure that you understand how panning and zooming works. When you are familiar with the controls, you have successfully completed Task 1.
Task 2: Elevation Filter (1P)
As explained in the course, an important concept for understanding the process of visualization is the so-called visualization pipeline:
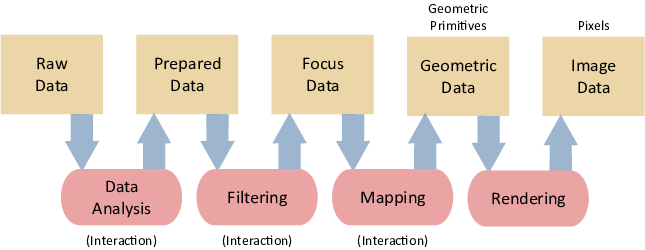
VTK implements this pipeline through so-called_filters_ – think of filters as the arrows that connect the different stages in the pipeline. The filters manipulate the data passing through them in various ways, so a typical task when prototyping visualization with VTK is to select the right filters, and then connect several of them together to form the visualization pipeline. These connections are handled through, well, connections.
For example, each filter requires an input connection through which it receives data. By connecting a data source (technically also a filter, but with not input) with other filters, mappers, actors and renderers, you construct a VTK pipeline.
Mappers and actors play a special role here: a mapper's job is to map a dataset into graphical primitives, and the actor is responsible for the actual rendering; hence these appear as the final two pipeline stages.
The file ex1.py contains a basic example for setting up a pipeline. It creates a cylinder data source, connects this to a vtkPolyDataMapper and renders the resulting cylinder. No filters are used (yet), so this pipeline is super short. Your job is to change that as follows.
Start with a simple elevation filter (vtkElevationFilter or vtkSimpleElevationFilter, pick one). This filter interprets the y-coordinate of the cylinder's points as height and maps this to color. You can specify the exact way in which it does this in various ways -- find out about this by reading the documentation at the links above.
Note however, that the elevation only depends on a direction. Still, please use sensible values (e.g. corresponding to the height of the cylinder).
Generally, to connect two filters, you need to use a construction of the form
filter2->SetInputConnection( filter1->GetOutputPort() )to make filter2 use the output of filter1 as input. Your elevation filter should connect directly to the datasource so e.g. set this filter's input connection to the output port of the data source.
(Note: It may be a bit confusing that all that is needed to connect some filters; when is the actual computation happening? VTK actually does this automatically. Basically, the vtkRenderWindow used in the code notices that a new image must be drawn and invokes the filters in reverse order. Intermediate results are cached, so as long as no parameters are changed, everything is computed only once. We'll look at this in more detail in a future homework.)
Summary of Tasks: Create an elevation filter based on the y-axis and connect it to the previous and following filters and mappers. What can you infer from the default colormap?
The resulting renderview should look like the following:
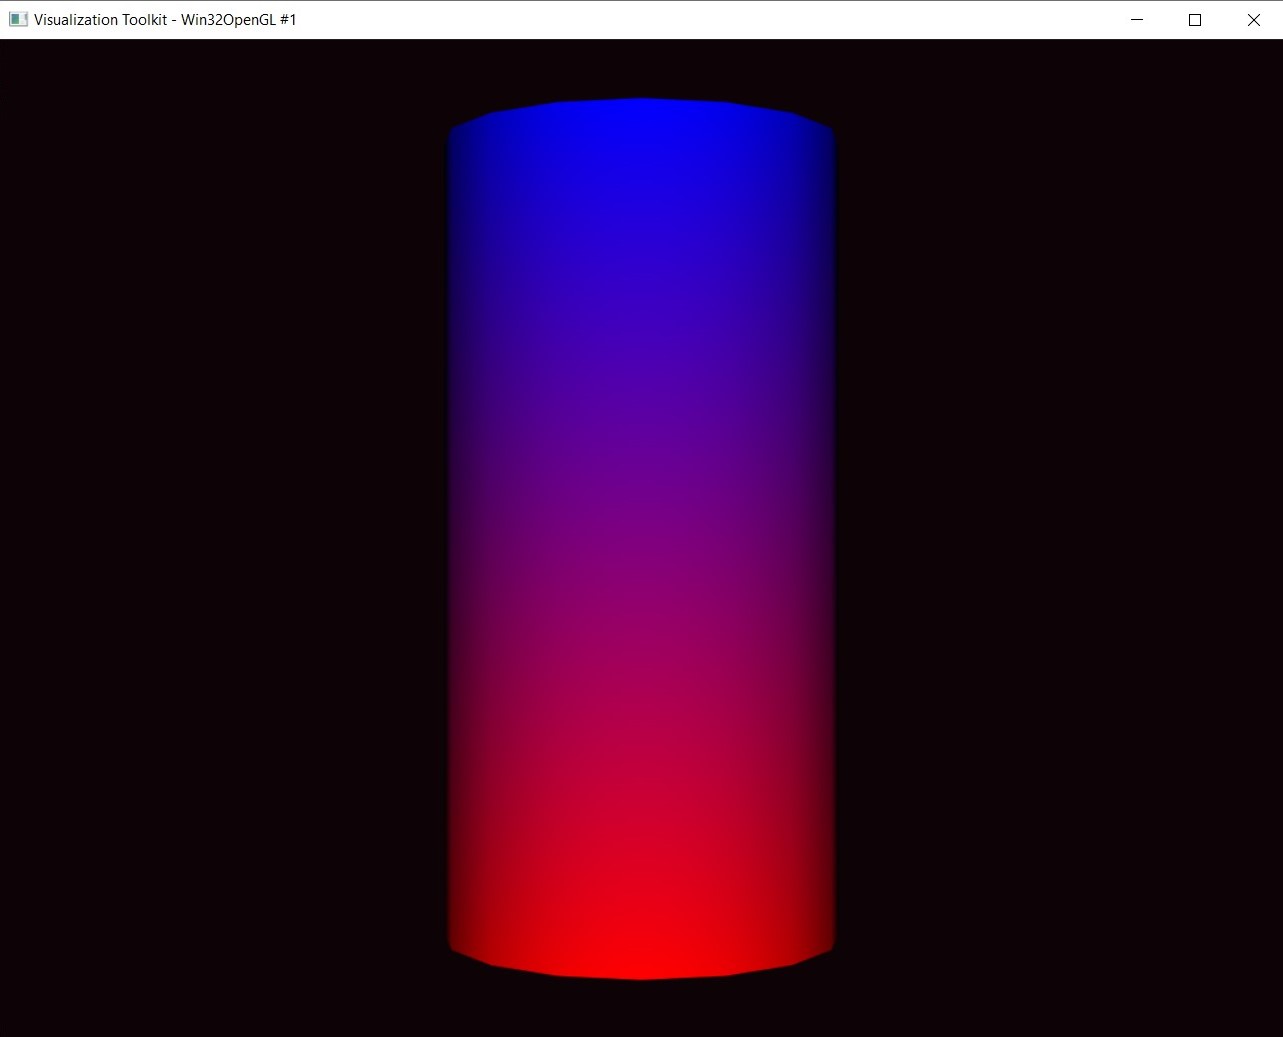 .
.
Hint: By the end of this exercise and task 3 your pipeline should look like this:

Task 3: Multiple Contours (1P)
The standard elevation effects color mapping, where the color of the cylinder corresponds to the height value of the elevation filter. Sometimes, color mapping is not sufficiently powerful, but it is rather desirable to extract curves of constant values, so-called isolines (e.g. height lines on a map; we'll discuss this in detail in the course in Chapter 3, but will simply use it here).
VTK gives us the possibility to extract these isolines using a vtkContourFilter. (This would be an example for the Filter stage of a visualization pipeline -- a height field is filtered down to leave only the height lines / isolines). Note that you can only extract contours based on elevation after applying the elevation filter, so the contour filter should connect to the elevation filter's output.
A second interesting visualization is to show a volume corresponding to everything in a specified range of values (e.g. every elevation between 400m and 500m). VTK by itself does not support such filtering directly, but we can work around this problem by simply extracting multiple contours in this range.
Test this out by extracting 20 isolines uniformly distributed between 0.4 and 0.5. (Hint: Look at set GenerateValues() method of vtkContourFilter.)
The resulting renderview should look like the following:
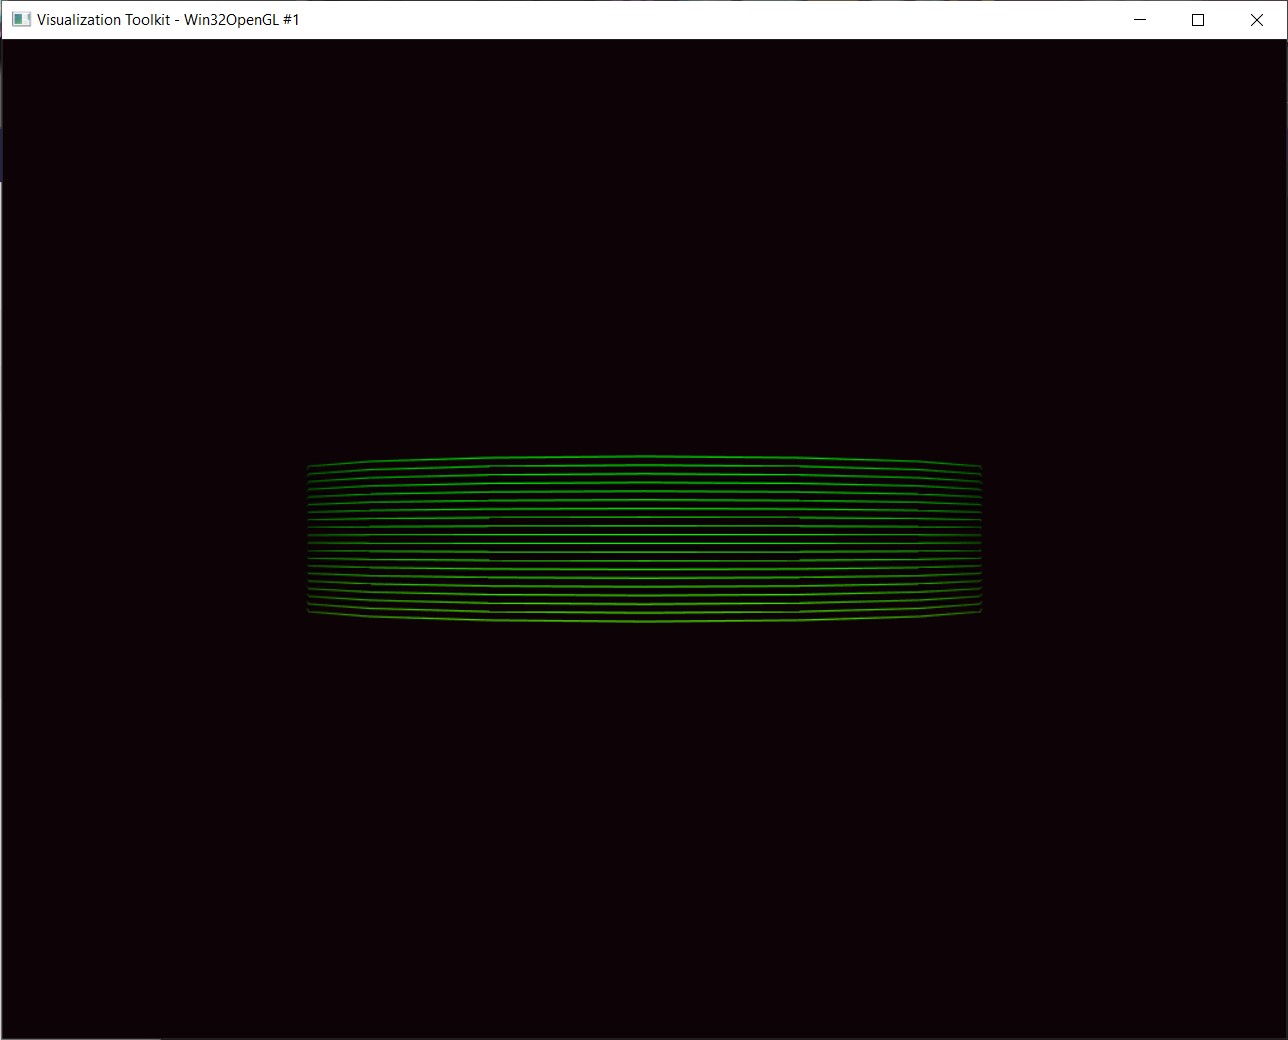 .
.
Summary of Tasks: Create a contour filter and connect it to the previous filters and following mappers. Extract 20 isolines between 0.4 and 0.5. What problem could arise if you want to approximate the isovalue?
Task 4: Export your results (2P)
Having computed filtered data in the previous step, let's take the opportunity to reflect data representation and file formats (course Chapter 2).
In this exercise, your job is to generate an unstructured grid representation of the height lines and save them to a file for later use. This can be accomplished by using a vtkAppendFilter. It is a filter that appends one or more datasets (input data) into a single unstructured grid. A vtkXMLUnstructuredGridWriter will write this to a file in VTK's XML format. Use the SetDataTypeToASCII() method to obtain human-readable output.
If you like, install and use ParaView to open the file and check if it is correct.
Summary of Tasks: Save the resulting visualization as an unstructured grid with the file name contour.vtu. Inspect the resulting file and try to find geometry, topolgy, and attributes.